I have been a technical analyst — or chartist, if you prefer — for 55 years, since reading that the stock market is the nearest thing to the classical economists’ definition of the perfect market, where price is determined purely in accordance with the law of supply and demand. More buyers than sellers, price rises; more sellers than buyers, it falls.
Shares frequently lead separate lives from the companies they represent. Buying and selling is guesswork, but can be educated or uneducated; technical analysis being the former. Short on theory, technical analysis is long on empirical observation. Freed from unreliable intellectual and emotional preconceptions, the technician is well qualified to forecast what prices are likely to do. Technical analysis is the triumph of experience over hope; fundamental analysis, the opposite.
Fundamentalists look at what they think will affect price in the future. Technical analysts just look at price: the balance between supply and demand, including all knowable facts and fantasies.
Most people think markets are cerebral. Wrong: they’re emotional. Thinking is what causes the largest losses. The price chart is a graphic representation of a psychological state, constantly updating market-players’ recognition of fundamentals and their willingness to discount the future.
Why do people buy? They think price is going to rise. Why do people sell? They think it’s going to fall. ‘People’ and ‘think’ are what matter, and all you need know is what people are thinking. When looking at price, you are not looking at real value; there is no such thing. It isn’t real value that drives markets but people’s perception of future value. Technical analysis is concerned not with certainty (there isn’t any in this business) but with probability: getting the odds on your side. If a technique works, we use it; if it doesn’t, we don’t.
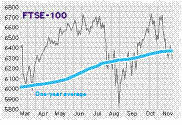
How does all this apply to the current FTSE-100 chart? The bull market continues, although a recent change in behaviour gives cause for concern: when a bull market changes character, it frequently signals transition from bull to bear. The one-year average (the sum of daily closes divided by the number of trading days in a year) is going up, so there is potential support; following a close or closes below the one-year average line, a close above it demonstrates that the support has worked.
The close below the average on 9 November and subsequent close above it was the fifth such event since the bull market started; after three of the previous four, the FTSE rose to a new bull-market high — the exception was in August, when the subsequent high of 6731 was marginally lower than June’s 6732. This failure to post a new high was the change in behaviour to which I referred.
Following a renewed close above the average on 13 November, the inference was a return to the high unless a new low beneath 9 November’s 6305 appeared; one did, on 16 November. The inference then became a fall to the low seen in August; the same applies to the FTSE 250. If those lows give way, the four criteria needed before I call a bear market will have been met.
Since 1980 there have been ten bear markets. The shortest (one month) lost 21 per cent of market value; the average decline has been 19.6 per cent; the average length has been six months. In the most recent, from 2000 to 2003, the decline was 51.7 per cent and the duration was 26 months. A bear market is the interval between two bull markets; it lasts from the high of the preceding bull market to the low on the eve of its successor. For most of the duration of each bear market, the one-year average is falling, but not initially; after the bear market has grounded, the average keeps falling for the first few months of the succeeding bull market.
If my bear-market criteria are met, the downside risk in the FTSE-100 will be a range of 5250 to 4850. Meanwhile, let us also observe that following four years of underperformance, the FTSE-100 has out-performed the FTSE-250 since April; my reading of the chart is that this out-performance will continue.


Comments