
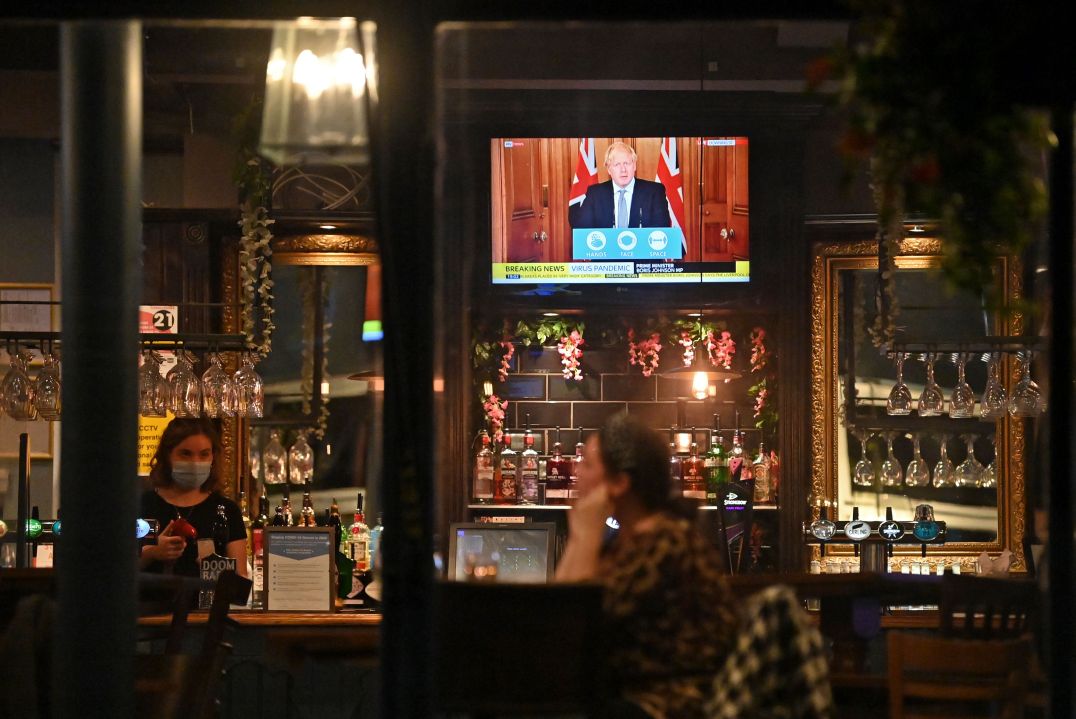
The graph presented by chief scientific officer Sir Patrick Vallance during Saturday’s press briefing suggested that, in the absence of a new lockdown, deaths from Covid-19 could reach 4,000 a day by Christmas. To put this scenario in context, deaths in the first wave back in April peaked at just over 1,000 a day.
Back in spring, a pre-publication copy of Neil Ferguson’s paper — the Imperial College modelling of Covid-19 deaths which sent Britain into the first lockdown — was released, so we could all see the assumptions and reasoning behind it. Saturday’s graph did not even reveal the source of the 4,000 deaths a day claim — although it has subsequently been revealed to be a Cambridge/Public Health England (PHE) estimate.
Now Daniel Howdon, a research fellow at the Leeds Institute of Health Sciences, and Carl Heneghan, professor of Evidence-Based Medicine at the University of Oxford, have discovered that the Cambridge-PHE graph dates from three weeks ago. The pair have analysed the data and deduced that it predicted that deaths would be running at 1,000 a day by 1 November — i.e. yesterday. In fact, deaths have not turned out to be at anything like that level. The average for the past seven days (which smooths out the ‘weekend effect’) is 214 deaths per day.
The other graphs presented on Saturday, according to Howdon and Heneghan, are also at least three weeks old. The second most frightening projection came from Imperial College, which showed deaths peaking at just over 2,500 a day by January. This scenario also showed that deaths would be running at 486 a day by 1 November — more than twice as high as has happened in practice. The London School and Hygiene and Tropical Medicine and University of Warwick projections, which showed deaths peaking at around 2,000 a day predicted 266 and 234 deaths a day by 1 November respectively.
Howdon and Heneghan point to their own preferred mortality projections, published by the MRC Biostatistics Unit at the University of Cambridge. These only go two weeks ahead, due to the huge uncertainties involved in trying to make forecasts further into the future. Importantly, its predictions have been falling in the past three weeks: on 12 October it predicted 588 deaths for 30 October. By 21 October, it was predicting 324 deaths for 31 October. Even that has turned out to be 50 per cent higher than the reality.
Why, then, did the government present us with graphs based on studies that have already proven to be overly-pessimistic? The very small print at the bottom of the graphs presented by Sir Patrick described them as ‘scenarios’ and not predictions. Nevertheless, that is exactly how they will have been taken by many viewers.


Comments