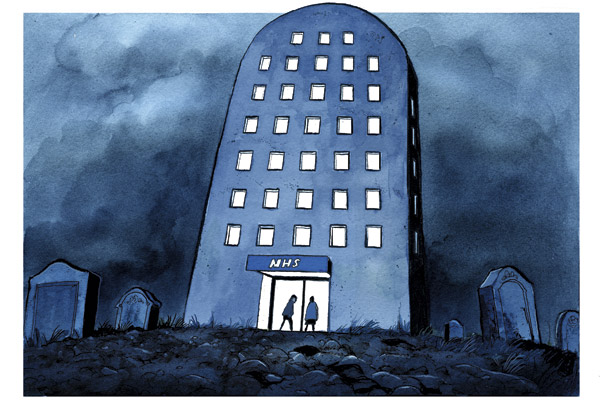
When the dust settles on the Keogh report published last week one figure is likely to linger: the “13,000 excess deaths” in the 14 NHS hospitals. It deserves careful scrutiny – and some has been applied by Isabel Hardman here with more details about this curious notion of “Hospital Standardised Mortality Rates” in the Health Service Journal here. But these still leave the question unanswered as to why these “extra” people are dying, and what, if anything, we can and should do about it. Here’s my attempt. It’s fairly detailed, and it’s still a lovely day so those who don’t have an appetite for such things may not want to click on the link. But those who do want to get their heads around this may find it interesting. The figure of 13,000 excess deaths was important enough to put on front pages of newspapers and quoted on the news bulletins, so it’s worth looking a little more at what it actually means.
Simplifying somewhat, we start with data which includes information on patients’ death or survival, and correlates that, using so-called regression analysis, with some observed characteristics – mostly specific health conditions and demographic characteristics. So we can say, for example, that a 55 year old male lung cancer patient has on average an X% chance of dying. Express that on a hospital level, and you have “expected” deaths. “Excess” deaths (or “excess” survival) are just the difference between actual deaths and the number “predicted” by the regression model for each individual hospital. A hospital with no excess deaths is one that performs exactly as the model predicts.
But – and this is the key point – these differences are simply the variation between hospitals that the regression model doesn’t predict. By definition, we don’t know what explains them; if we did, we’d have put it in the model in the first place as one of our explanatory variables. The ‘excess’ figure – again by definition – comes from the things we’ve left out of the model – the so-called “omitted variables”, as well as from pure random variation.
Now one of those omitted variables is almost certainly hospital performance, or quality, unless you think such things don’t matter at all . But it is almost certain there are others as well (in addition, the model is almost certainly “misspecified” as well, which introduces additional complications and biases). But the bottom line is that hospital performance will only explain some of the “excess” deaths calculated from the model – and the model itself won’t tell us how much.
A few important and policy-relevant points follow from all this:
1. Differences between actual and “predicted” deaths are a useful diagnostic. They tell you that something is going on in that hospital that’s not in the model. That certainly justifies sending inspectors in to hospitals where those differences are large; but it definitely doesn’t tell you that the difference between predicted and actual deaths in any given hospital is down to performance; or that in aggregate what proportion of the differences are down to performance.
2. There is no sense in which the average (the regression line) given by the model is the right outcome. Suppose all hospitals had actual death rates that were at, or very close, to the “predicted” ones. Would that mean everything was fine? It might mean performance was uniformly good (whatever that means!). But it might equally mean performance was uniformly awful.
3. There’s no reason why we should take differences from the “expected” rate as the relevant metric. It would be just as legitimate to take the best 25% and look at differences between that and individual hospitals. Lots of businesses do take this approach – everyone should aim to get their performance to that of the top quartile.
4. What about the hospitals which have actual death rates below the “predicted” ones? Are they saving “extra” lives, and how? As with the extra deaths, the answer is possibly, although we don’t know how many. But certainly it would be just as justifiable to send in inspectors to them to find out what they’re doing right. Again, lots of businesses would do exactly that.
It would be far more satisfactory if we had an actual, quantifiable measure of quality or performance. We’d then know how much of the variation was being driven by quality/performance, and how much by chance or other omitted variables. In other words, we’d be explaining differences in death rates, rather than identifying differences that we can’t explain. That seems a lot more useful. Of course, we don’t have perfect measures. But you can think of some things that it would be interesting to look at – e.g. nurse-patient ratios, years of experience for doctors, management/clinical staff ratios, etc. I apologise in advance who to any health economist/statistician who knows the relevant literature and may be able to cite examples of such research.
Policy matters too. In particular, Carol Propper and her co-authors have looked at the impact of choice and competition within the NHS, and generally finds positive outcomes; that is, increased competition, under the right conditions, can reduce mortality (interestingly, the general finding is that competition over “quality of care”, rather than price competition, is what matters). Arguably, if you’re trying to make general health service policy, rather than to find hospitals where individual management failures may or may not exist, this is sort of research that’s really needed.
PS I’m not a health economist or statistician, so this is primarily about the number crunching – or regression methodology – in question. The same method is used a lot in various statistics you see in the newspapers: for example, the assessment of school performance using “value-added” measures.
Jonathan Portes is director of the National Institute of Economic and Social Research and former chief economist at the Cabinet Office


Comments