

What would have been your overall chances of dying in the first 19 weeks of 2021 compared with recent years? According to a measure called ‘standardised mortality’ your overall chances of dying so far in 2021 have been just 1 per cent over the average of the past ten years — that is in spite of January’s peak in Covid deaths.
We have been fed a daily diet of Covid deaths for over a year now. As Professor Gordon Wishart argues elsewhere on Coffee House, this daily bulletin has become pretty pointless now that deaths and hospitalisations are so low; a monthly total would be better.
Yet even at the height of the pandemic, the daily death figures were giving us a false impression of the death toll because they were never set in any context. We have just been fed a daily total of ‘Covid’ deaths without any analysis of who is dying — what age, other medical conditions, and so on. Moreover, they don’t tell us how many people have been dying — or not been dying — of other conditions.
The weekly ONS mortality figures give a more rounded view of just how many people have been dying as a result of the pandemic, but they, too, are faulty because they compare the current number of deaths with the average for the past five years. They do not take into account the fact that the population is growing — and ageing. The number of over-70s, for example, is expanding at around 2 per cent a year so we would expect the number of deaths to grow over time, even without a pandemic.
The fairest way to compare overall deaths during the pandemic with those in previous years is through standardised mortality. This tells you how the death rate changes over time, taking into account the age of those dying, and the age profile and size of the population. Figures for standardised mortality are published weekly by the Institute and Faculty of Actuaries — and are freely available online.
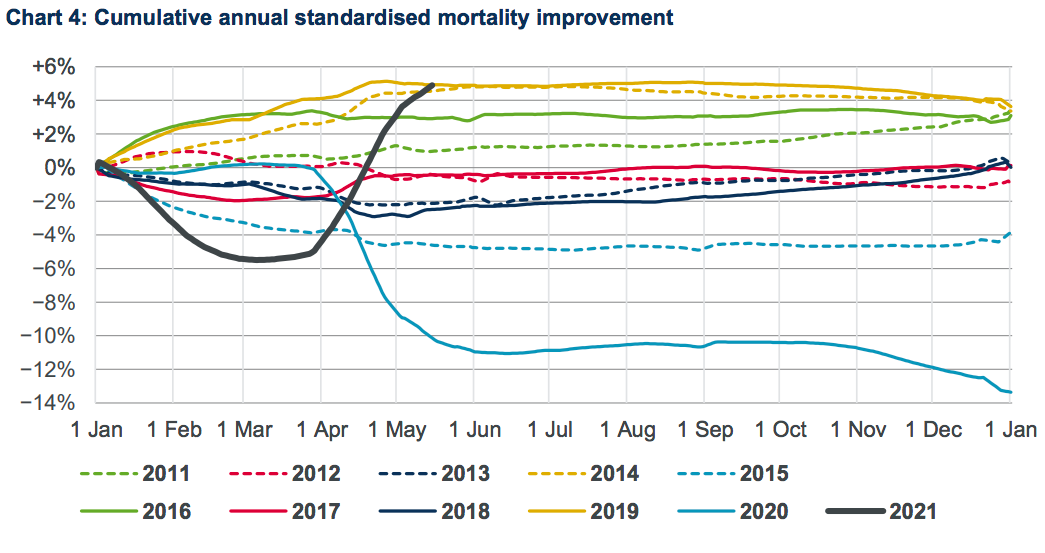
The latest bulletin, for week 19 of 2021 shows that the mortality rate for 2021 as a whole is running 4.6 per cent ahead of what it was by this stage in 2019. But then 2019 was a year of especially few deaths. The mortality rate has already fallen below what it was by this stage of 2018, 2015, or 2013.
The Institute and Faculty of Actuaries has been publishing its mortality monitor since the beginning of the pandemic. It showed that over the whole of 2020, the mortality rate was 7 per cent higher than the average of the previous 10 years. Serious though the pandemic has been, it had merely taken the mortality rate back to what it was in 2008.
This week the Institute has effected a change in the presentation of its statistics, which makes it a little harder to compare the mortality rate with previous years. Until week 18 it published a graph showing the mortality rate relative to the average of the past ten years; now it shows the mortality rate relative to 2019. This change occurred just as 2021’s mortality rate was sinking towards the ten year average. In week 18 it stood at just above 1 per cent, and, to judge by its downward trend, seemed destined to fall below the ten year average in coming weeks.


Comments