Another day, another slew of house price data. But with Article 50 now triggered, recent Bank of England data showing record levels of household debt, and the prospect of an interest rate rise later this year thanks to rising inflation, property statistics are throwing up a few surprises.
Lowest growth in two years
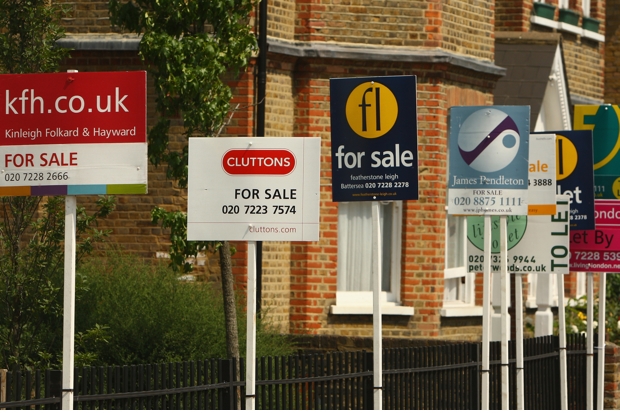
There’s further evidence of a slowdown in the UK housing market this morning. According to Nationwide, house prices are increasing at their lowest pace in nearly two years. Britain’s biggest building society says that the average price of a home fell 0.3 per cent to £207,308 following a 0.6 per cent rise in prices in February. It was the first fall on the Nationwide index since June 2015 and came as a surprise to City analysts who had expected a 0.4 per cent increase in prices. As a result, the annual rate of growth is now at a 19-month low of 3.5 per cent.
Nationwide’s data follows Bank of England figures showing a drop in mortgage approvals last month and information from the Royal Institution of Chartered Surveyors which has said that the average number of homes for sale is ‘just shy of a record low’.
House price growth outperforms in areas where unemployment has fallen
While the national house price growth stats make for depressing reading (well, not if you’re a first-time buyer), there’s some good news for parts of the country.
Lloyds Bank has found that the 20 areas that have recorded the sharpest falls in unemployment have, on average, seen house price gains of almost double the national average over the past decade: 48 per cent against the national average of 25 per cent. The ten areas with the biggest unemployment declines have seen an even larger house price rise, averaging 53 per cent, between 2007 and 2017. The best performing area in this sector is the London borough of Waltham Forest, which has experienced a 92 per cent house price rise over the past decade from £233,779 to £449,384.
However, in the 20 areas with the poorest unemployment performance – where unemployment claimant counts have fallen by an average of 0.2 percentage points since 2007 – average house prices increased by 26 per cent. Most of these areas are in the South East and the South West.
Build-to-rent sector springing to life
Following last week’s news that Manchester tops UK cities for house price growth (according to Hometrack, prices in the city increased by 8.8 per cent in February), this northern metropolis has been singled out by the British Housing Federation (BHA) for build-to-rent properties.
The BHA reports that there are in excess of 5,500 build-to-rent properties under construction in Manchester and Salford. Build-to-rent comprises purpose-built, professionally managed rented homes. When compared with London, this is much more than the capital when looked at on a per capita basis.
Help-to-Buy used by more than one million
The Treasury said yesterday that more than 259,000 people have bought a home using one of the government’s Help-to-Buy schemes, and over 868,000 have opened a Help-to-Buy ISA.
Under the Help-to-Buy scheme, buyers are offered up to 20 per cent of a newly built home’s costs (40 per cent in London) so they only need to provide a 5 per cent deposit.
According to the government, the majority of those using the scheme are first-time buyers. The average house price across the schemes is £192,854, which is below the national average of £220,000.
Helen Nugent is Online Money Editor of The Spectator


Comments