Lost property
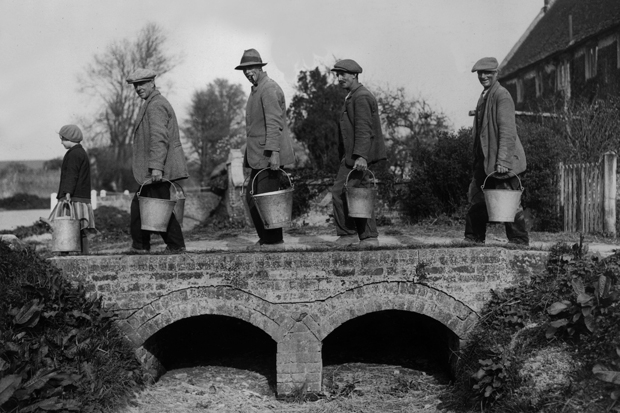
The second-to-last surviving resident of St Kilda — a small archipelago 40 miles off the Outer Hebrides which was abandoned in 1930 — has died. There are more than 4,000 abandoned settlements in Britain:
Althorp Medieval village on the Althorp estate, Northamptonshire, removed by the Catesby family in the early 16th century to make way for sheep pasture
Imber Isolated village on Wiltshire downs which was evacuated and added to the adjoining military range in 1943 to train US troops. The buildings survive, including a mock housing estate built to simulate conditions in Northern Ireland
Rattray Ancient town in Aberdeenshire created Royal Burgh by Mary, Queen of Scots in 1563 but abandoned after sand dunes cut off its harbour in 1720
Cratendune Church and settlement in Cambridgeshire established in 607 and destroyed around 650. Mentioned in Anglo-Saxon texts but remains still missing
In and out
David Cameron had a modest reshuffle, sacking only one cabinet minister. Are ministers now more or less expendable?
| Reshuffles | |
| Blair ’97-’01 | 7 |
| Blair ’01-’05 | 8 |
| Blair ’05-’07 | 3 |
| Brown ’07-’10 | 3 |
| Cameron ’10- | 3 |
| Ministers employed | |
| Blair ’97-’01 | 34 |
| Blair ’01-’05 | 31 |
| Blair ’05-’07 | 27 |
| Brown ’07-’10 | 27 |
| Cameron ’10- | 29 |
Profit share
Applications for Royal Mail shares closed, with some analysts predicting instant profits of 40 per cent. What profits did investors make on 1980s of utilities in the 1980s?
| Profit after 1 day | |
| BT | 35% |
| British Gas | 10% |
| Water (ave) | 20% |
| Powergen | 22% |
| National Power | 22% |
| Profit after 1 year | |
| BT | 84% |
| British Gas | 24% |
| Water (ave) | 39% |
| Powergen | 29% |
| National Power | 22% |
Source: CESifo
Through the roof
Chief Secretary to the Treasury Danny Alexander said house prices are not high now compared with their long-term average. How do house prices compare with what they were at the last two peaks?
| 2007 | |
| London | -10% |
| South East | -20% |
| West Midlands | -24% |
| North | -28% |
| Wales | -26% |
| Scotland | -26% |
| N. Ireland | -61% |
| 1989 | |
| London | +55% |
| South East | +12% |
| West Midlands | +17% |
| North | +27% |
| Wales | +16% |
| Scotland | +41% |
| N. Ireland | +71% |
Source: Nationwide/ONS


Comments