Mx Universe
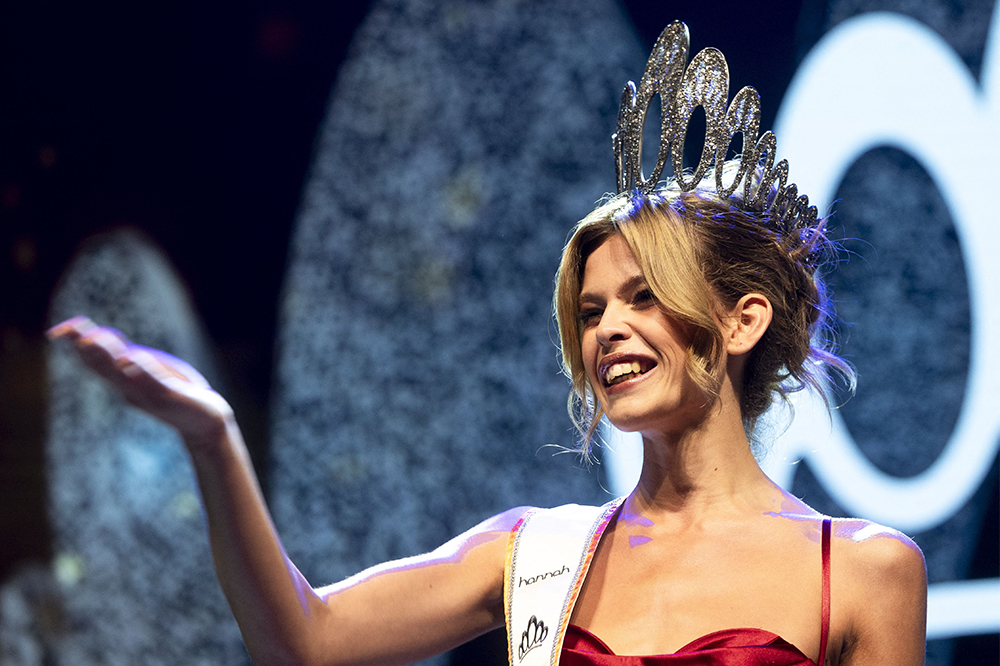
A transgender woman was named ‘Miss Netherlands’, and will now compete in the Miss Universe contest. British TV viewers might be surprised to learn there are still such things as beauty pageants, given they disappeared from the main TV channels in the 1980s. They might be even more surprised to learn who was responsible for lifting the ban on transgender women taking part in Miss Universe.
– The decision was made in 2012 by Donald Trump, who then owned the franchise for the competition, after a Canadian trans woman, Jenna Talackova, had been banned from taking part and her cause had been taken up by the Gay and Lesbian Alliance Against Defamation.
– Remarkably, the contest continued to ban women who were married or pregnant, although that was lifted this year.
A visit from Potus
How many visits have US presidents made to the United Kingdom?
John F. Kennedy 2
Lyndon B. Johnson 0
Richard Nixon 3
Gerald Ford 0
Jimmy Carter 1
Ronald Reagan 3
George H.W. Bush 3
Bill Clinton 7
George W. Bush 5
Barack Obama 5
Donald Trump 3
Joe Biden 5
Fluctuating productivity
How has public sector productivity changed in the past quarter-century?
Index set at 100 in 1997
1999 100.5
2001 100.7
2003 98.8
2005 99
2007 99.8
2009 98.1
2011 99.2
2013 101.1
2015 101.3
2017 103.3
2019 104.6
2020 88.7
2021 95.2
2022 96.8
(The 2021 and 2022 figures are described as ‘experimental’)
Source: Office for National Statistics
Hot spots
How did per capita greenhouse gas emissions vary across the country in 2021 (measured in tonnes of CO2 equivalent)?
London 3.4
South-east 4.7
South-west 5.6
W. Midlands 5.7
North-east 5.7
North-west 5.9
East 6
E. Midlands 6.9
Yorks & Humber 7.1
Scotland 7.4
Wales 9.4
N. Ireland 10.6
Source: Dept for Energy Security and Net Zero


Comments