

Since January, some 22,000 more Brits have died at home than would be expected in a normal year. These so-called excess deaths at home had stumped doctors and left GPs calling for an investigation. The causes remain unclear but a study published today offers the first clues to what’s going on.
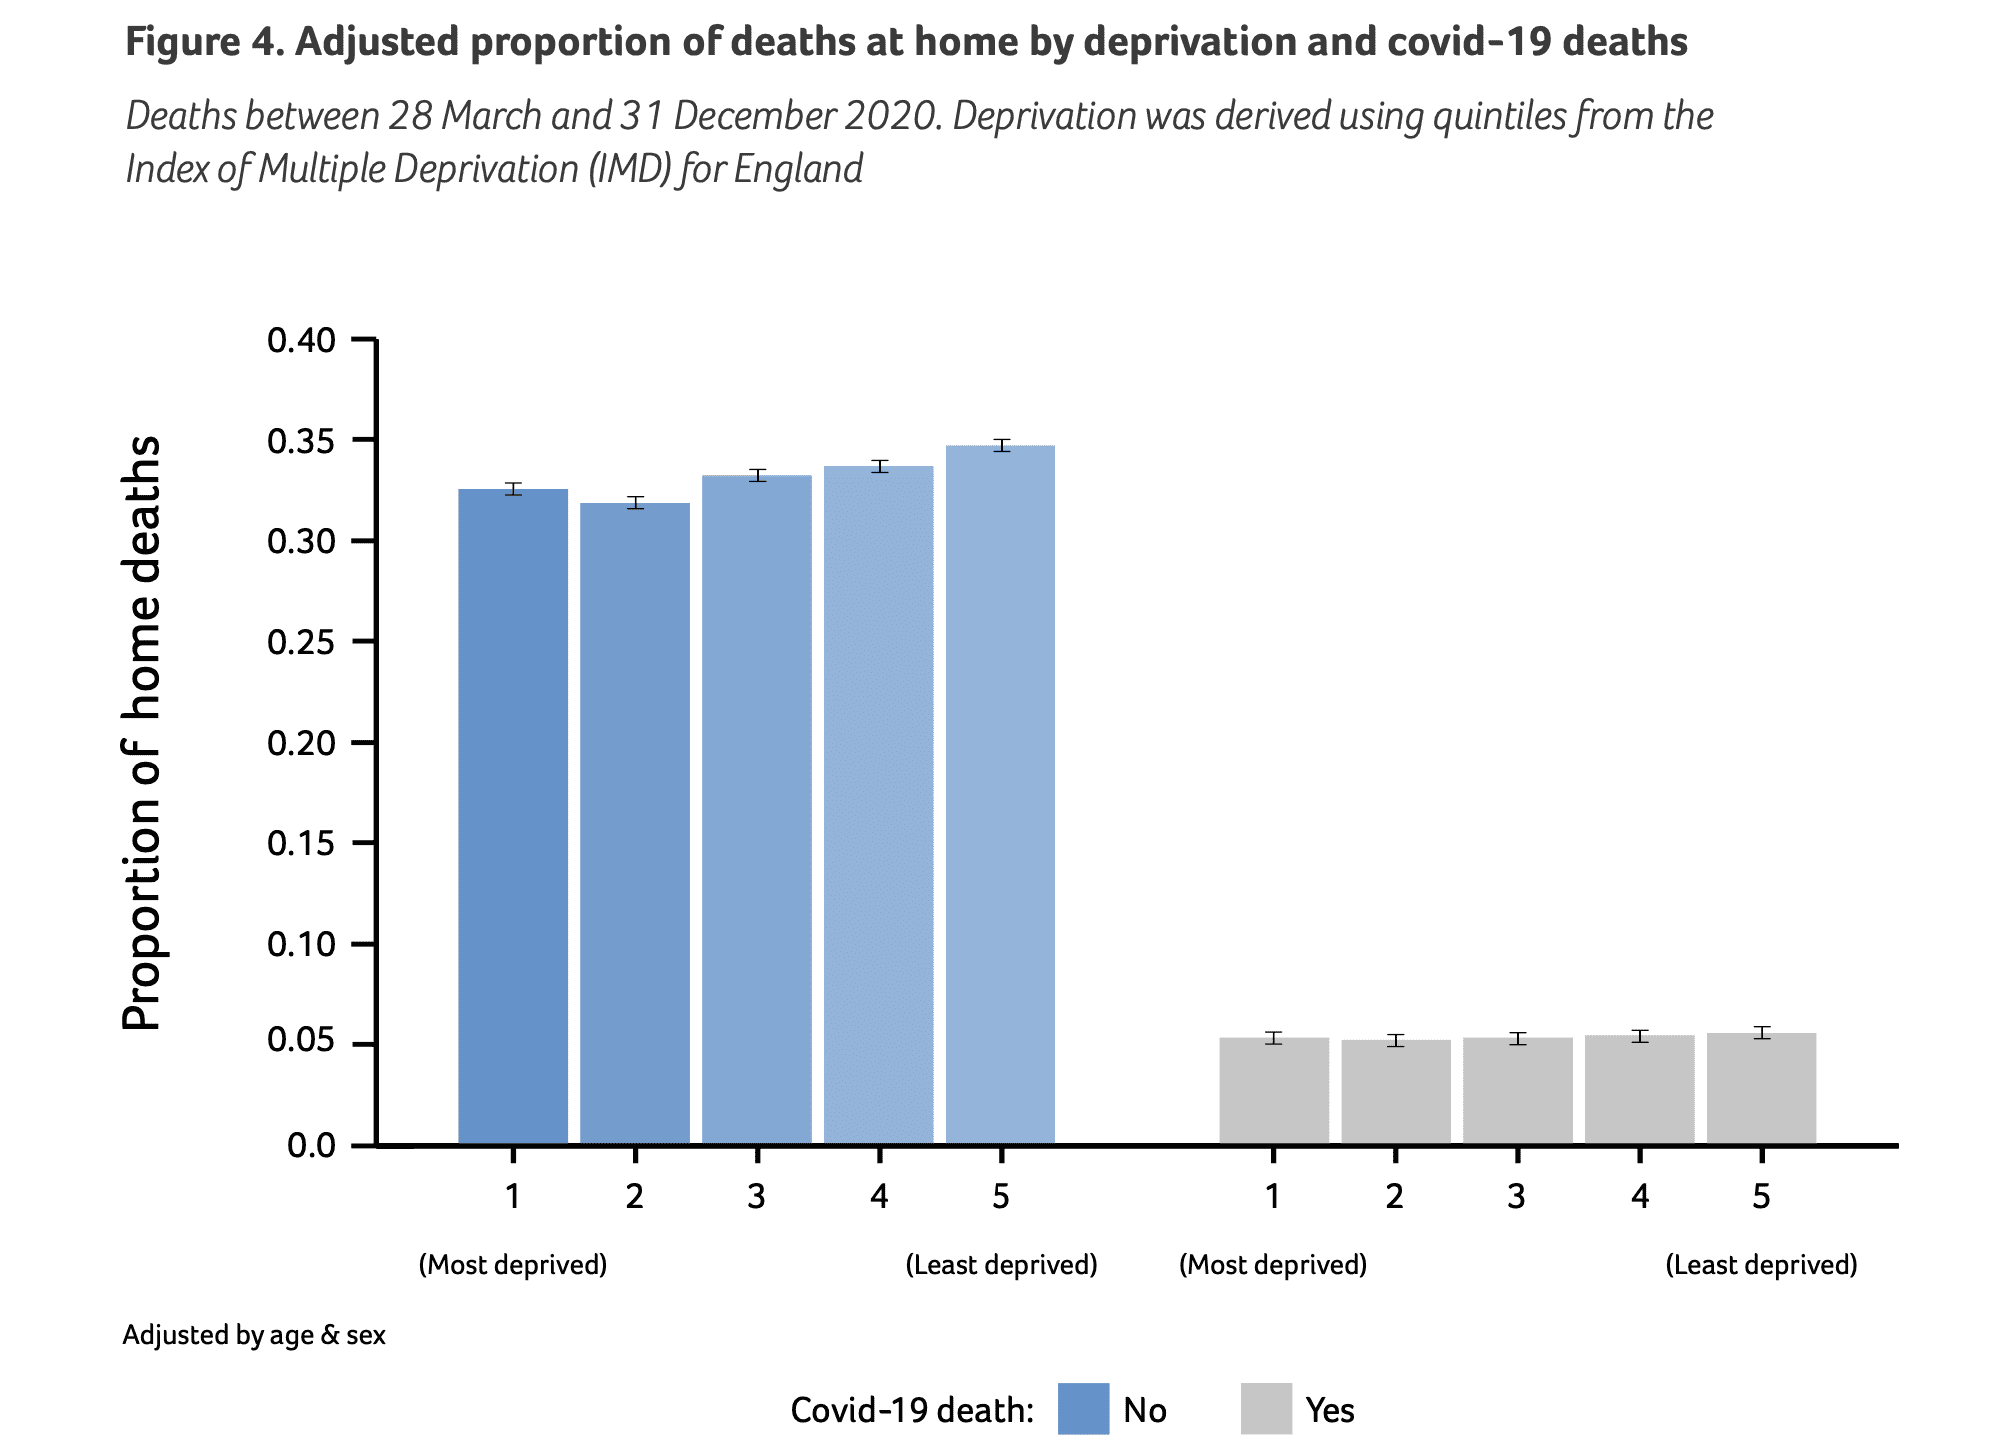
The study, funded by Marie Curie, found that deaths at home increased sharpest in the most affluent areas during the pandemic. While excess deaths occurred in all groups, in England there were 33 per cent more at-home deaths than pre-pandemic in the least deprived areas. Meanwhile, deaths in the most deprived areas grew just 21 per cent. In Scotland the increases were even starker: 44 per cent in the least deprived and 36 per cent in the poorest areas.
There has always been a gap in where the rich and poor die: wealthy areas are well served by at-home end-of-life care while poorer areas are left with resources focused around hospitals and hospices – with less choice for at-home care. This gap accelerated during the pandemic. While the well-off could spend their last days surrounded by loved ones at home, the poor were forced into hospitals in the middle of Covid outbreaks and draconian restrictions on visitors.
This poverty-related death gap was clearest between the first two Covid waves, a period where there were fewer virus deaths. The researchers say this suggests the change ‘may be sustained beyond the pandemic.’ The link between the surge in at-home deaths and less deprived areas wasn’t present when the study’s authors looked just at deaths caused by Covid. This means the change in where people die was not caused by Covid itself but by the restrictions put in place to tackle it and by the closing down of the health system.
In 2020, the period of the study, the NHS had effectively shut down anything non-Covid related. Many of the effects – waiting lists climbing above six million, 80 per cent of GP appointments being carried out over the phone and hour-long ambulance waits – still persist today. This morning’s monthly NHS statistics continue to paint a picture of a struggling health service driving people away. Here are some of the main points from today’s data release.
First, those waiting more than a year for NHS hospital treatment rose by a further 9,000 to 332,000, some 5 per cent of all patients. This is already 85,000 above what had been expected had Omicron turned out to be mild (as was the case). The total number of people waiting for hospital treatment for any length of time reached 6.6 million – up 124,000 in a month in line with forecasts and on course for nine million by the general election. There was better news for those suffering the longest waits: two-year waits fell by 37 per cent but still sit at just over 8,000.
Secondly, A&E activity is back to normal pre-pandemic volume – but the figures are still at crisis level. Some 2.2 million people attended A&E, about where it was for most of 2019. The difference is that its summer. Why are things so challenging, if A&E volumes are back to normal? (Or, at least, normal since GP appointments became so hard to get that people rock up to A&E?) It was the busiest June on record for A&E and around the same level as the month before. Almost 900,000 emergency calls were answered too, against the busiest June since records began.
Thirdly, there is bad news on 12-hour A&E waits: they are back up to 22,000 after falling last month to 19,000. Over 130,000 patients were not seen within the four-hour target either.
Fourthly, ambulance waiting times worsened too after improving in May. The average response for a category two emergency call rose by over ten minutes to 51 minutes, back to winter levels. Category one emergency calls – where there is an ‘immediate threat to life’ such as cardiac arrest – had an average response time of nine minutes. Around the same as the nine-minute average recorded in May.
Finally, cancer diagnosis still haven’t reached their (fairly unambitious) target: 75 per cent of patients either having cancer confirmed or ruled out within four weeks. The figure is still at 71 per cent, the same level as last month. That 28-day cancer diagnosis target hasn’t been met for 14 months.
NHS performance remains at pandemic-induced levels. Some headway is being made in dealing with the longest backlogs but progress is almost terminally slow. Given these factors pushed a rise in at-home deaths in 2020, and the proportion of people dying at home is higher than ever, there is every sign that the inequality gap in where people die will only continue to grow.


Comments